")
The good news is that it all changes again next Sunday.
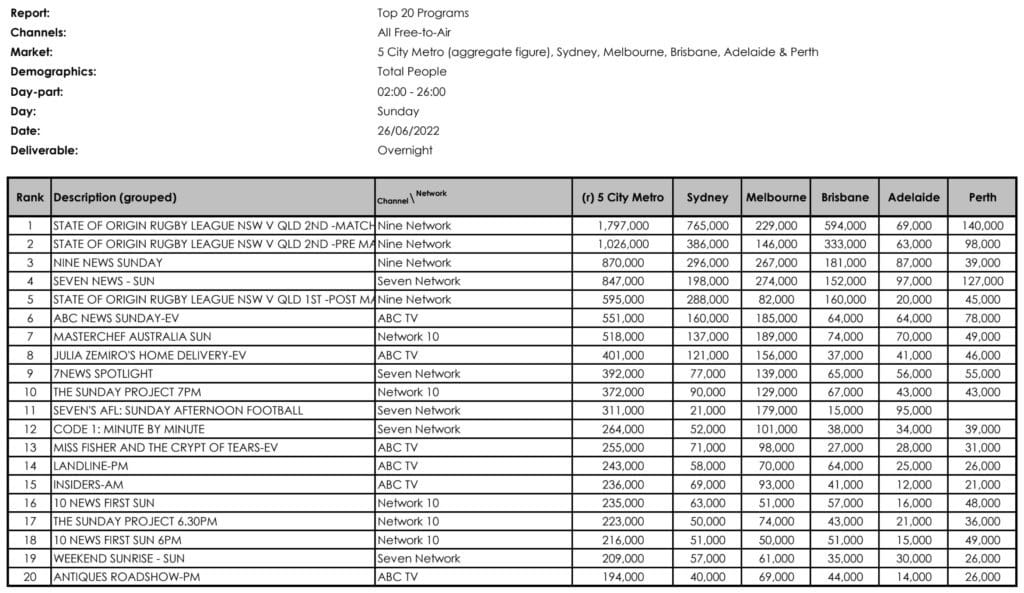
T’was all about the footy for Nine, with Origin taking a swift hold of both the schedule and the bulk of the audience. State of Origin Game 2 – pre match (1,026,000) built into a growing State of Origin Game 2 (1,797,000), but a smaller State of Origin Game 2 – post match (595,000). The game figures sure to grow with the addition of the BVOD numbers given how large they were for Game 1. The later evening is bulked out with The First 48 (125,000) and Accident, Suicide or Murder (76,000).
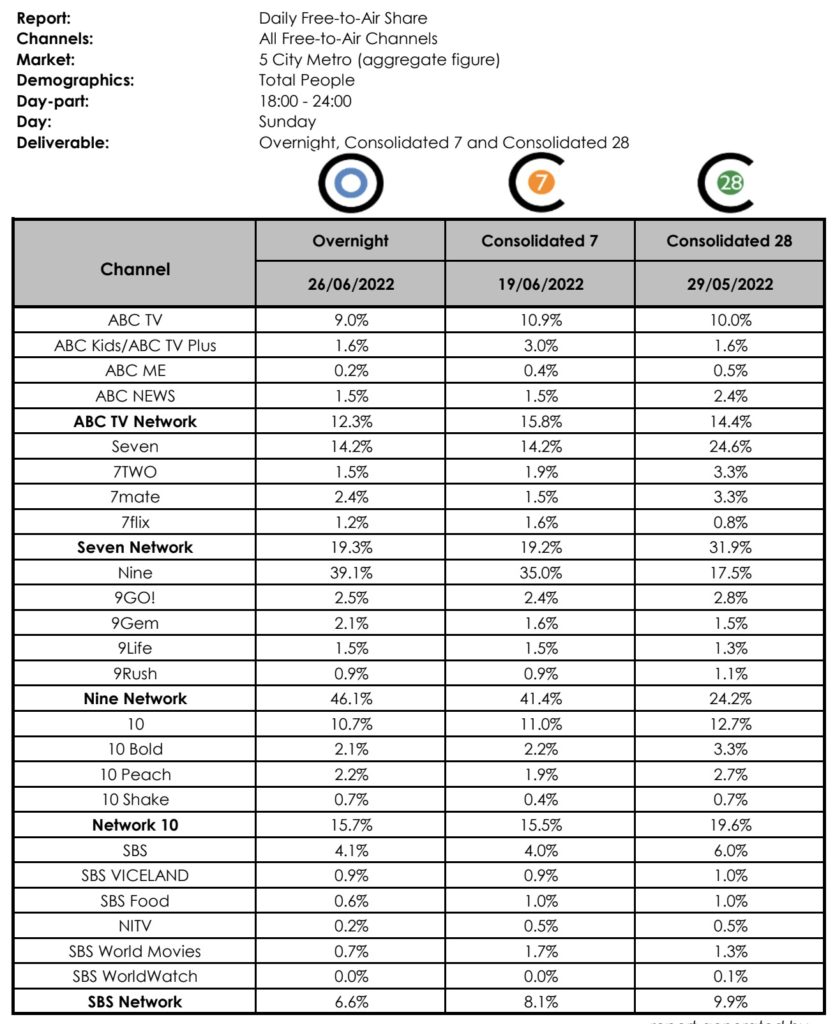
Nine first in both primary (39.1%) and network (46.1%) rankings.
7News Spotlight (392,000) suffers from the Festival of the Boot, as does the rest of Seven’s offerings. Code 1: Minute by Minute (264,000) and a repeat MOVIE: Pretty Woman (194,000) doesn’t offer much from the audience. A new episode of The Blacklist (43,000) pops up.
Seven second in both primary (14.2%) and network (19.3%) rankings.
10 see a little bump up from The Sunday Project (223,000 6:30pm; 372,000 7pm), and certainly a bump for MasterChef Australia (518,000) from Thursday (though down on last Sunday). NCIS: Hawaii (191,000) and a repeat FBI (107,000) both lift on last week too.
10 third in both primary (10.7%) and network (15.7%) rankings.
Julia Zemiro’s Home Delivery (401,000) slides a little for the ABC though largely maintains the rage. The second and final part of Miss Fisher and the Crypt of Tears (255,000) slips in linear broadcast though picks up in TotalTV figures. Then we slide into a night of repeats, starting with A Life In Ten Pictures (143000) through Harrow (54,000) and Parkinson in Australia (113,000).
ABC fourth in both primary (9%) and network (12.3%) rankings.
Pompeii: The Origins (101,000) leads the charge on SBS, followed by repeats of 10 Mistakes That Sunk The Titanic (104,000) and Uranium: Twisting the Dragon’s Tail (61,000).
SBS fifth in both primary (4.1%) and network (12.3%) rankings.
KEY DEMOS
16-39: State of Origin Game 2 (518,000) lands the win ahead of SOO pre-match/post-match, Nine News Sunday, and MasterChef Australia.
18-49: State of Origin Game 2 (759,000) beats out of SOO pre-match/post-match, Nine News Sunday, and MasterChef Australia.
25-54: State of Origin Game 2 (803,000) scores a triple demo win, followed by SOO pre-match, Nine News Sunday, SOO post-match and MasterChef Australia.
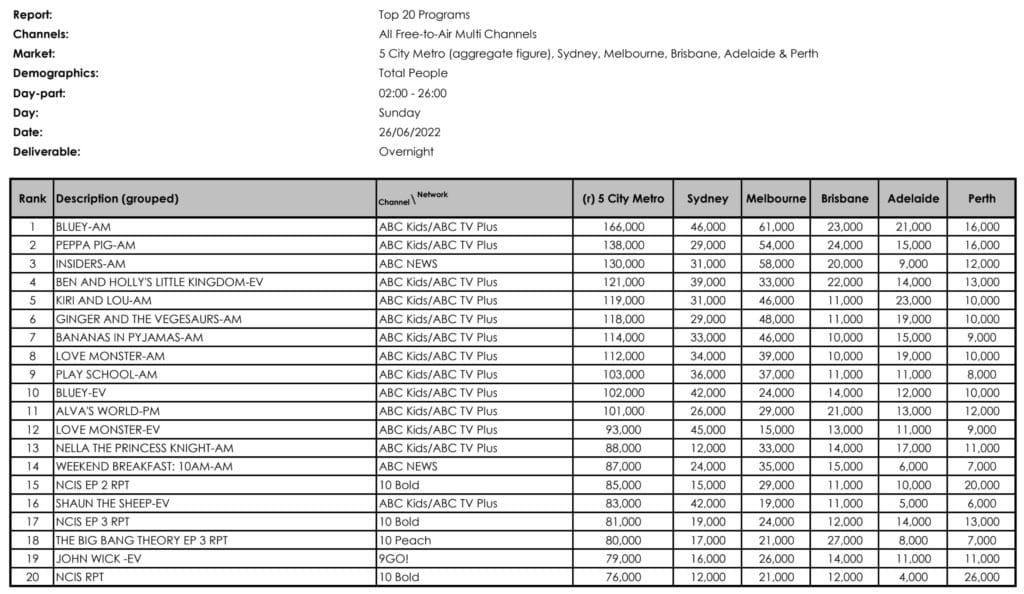
MULTI-CHANNELS
Bluey (166,000) on ABC Kids/TV Plus lands another multi-channel win.

EVENING NEWS BATTLE
| Service | Time | O’nights (cume/avg) | Note |
| ABC News | 7pm-7:30pm | 551,000 | |
| SBS World News | 6:30pm-7:30pm | 153,000 | 174,000 6:30pm 131,000 7pm |
| Seven News | 6pm-7pm | 847,000 | |
| Nine News | 6pm-7pm | 870,000 | |
| 10 News First | 5pm-6:30pm | 235,000 5pm 216,000 6pm |
SBS World News averaged ((6:30pm+7pm)/2) to obtain total program figure.
BREKKY BATTLE
Weekend Sunrise: 209,000
Weekend Today: 173,000
Weekend ABC Breakfast: 161,000 (91,000 ABC; 70,000 ABC NEWS)
Insiders (366,000 (236,000 ABC; 130,000 ABC NEWS))
Offsiders (190,000 (133,000 ABC; 57,000 ABC NEWS))
DAILY CONSOLIDATED 7 TOTAL TV
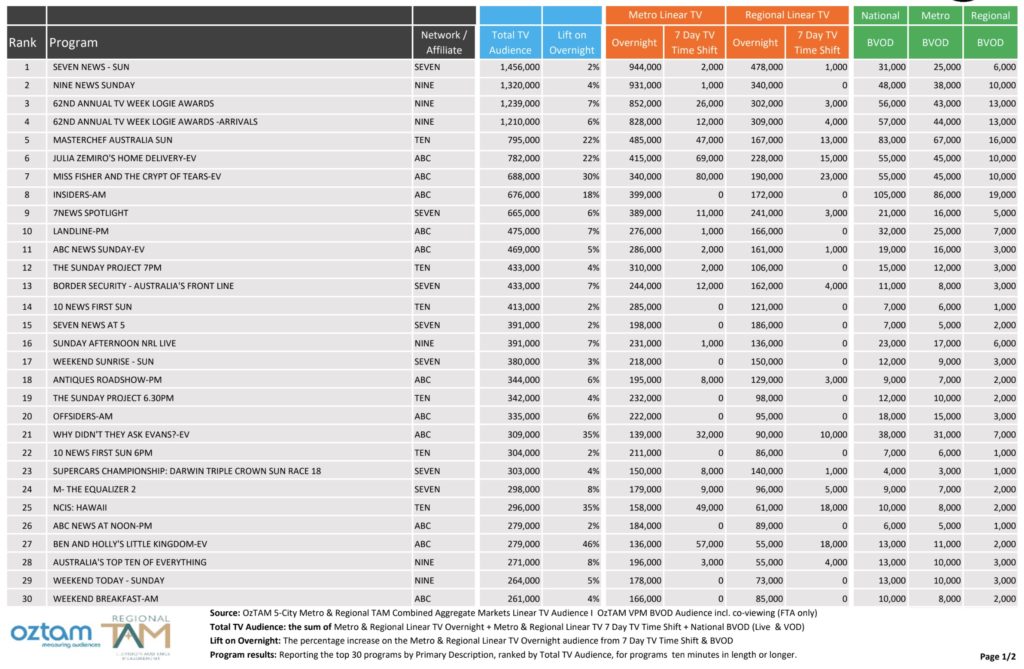
No changes to the previous week’s primetime line-up after the Total TV figures were added: 62nd Annual TV Week Logie Awards (Nine) lifted 7% to 1,239,000; MasterChef Australia (10) lifted 22% to 795,000; and 7News Spotlight (Seven) lifted 6% to 665,000.
The BVOD best was Insiders – AM (105,000).
Here’s the six shows that lifted the most from their overnight figures:
| Program | Network | Total TV | % lift |
| Ben and Holly’s Little Kingdom | ABC | 279,000 | 46 |
| Why Didn’t They Ask Evans? | ABC | 309,000 | 35 |
| NCIS: Hawaii | 10 | 309,000 | 35 |
| Miss Fisher and the Crypt of Tears | ABC | 688,000 | 30 |
| MasterChef Australia | 10 | 795,000 | 22 |
| Julia Zemiro’s Home Delivery | 10 | 782,000 | 22 |
Primary Channels, Multi-Channels, Shares, Subscription TV, Key Demos, Brekky Battle: All figures Total People, Five City Metro (5CM); overnights only.
Daily Consolidated 7 Total TV: All figures Total People, Consolidated 7 day Five City Metro (5CM) + Regional (Reg) + BVOD (Broadcast Video on Demand); % lift compared to overnight figures.
Top 20 Overnight Metro
Top 20 Multi-Channel Shows
Overnight Network Share
Top 20 Foxtel Shows

Daily Consolidated 7 Total TV Program Rankings
Data © OzTAM Pty Limited 2024. The data may not be reproduced, published or communicated (electronically or in hard copy) in whole or in part, without the prior written consent of OzTAM.
Note: Program performance and ranking information subject to change when not based on final program logs. Programs with the same name on one or more primary or multichannel, are aggregated into one network figure.