
GRUEN premieres for the ABC and lifts their comedy Wednesday even against a massive game of rugby league.
Channel 9
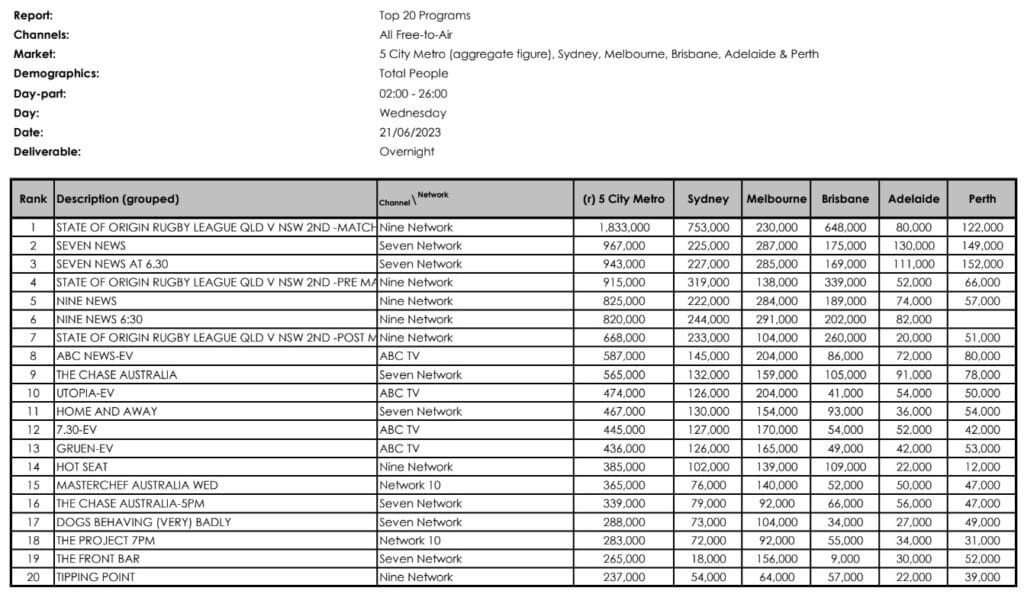
Nothing comes close to Origin, and Nine know it. It played out like this: State of Origin Game 2 – Pre-match (915,000), State of Origin Game 2 (1,833,000), and State of Origin Game 2 – Post-match (668,000), before the night closed out with The Equalizer (76,000). The BVOD figures for the game add a whopping 563,000 – larger than game one in this series.
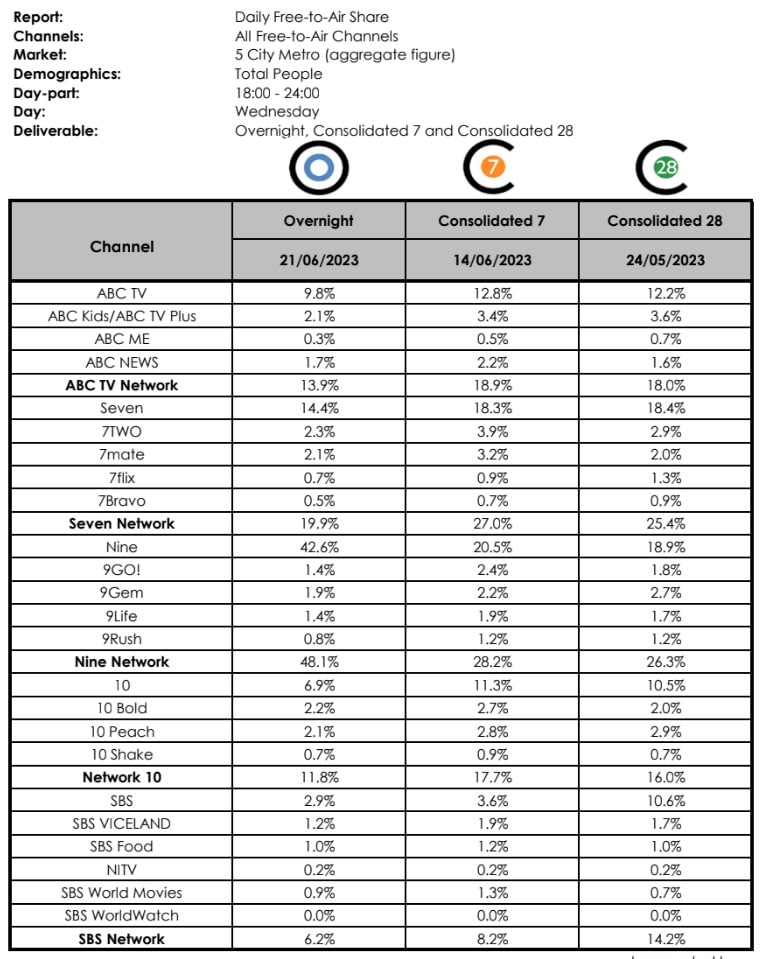
Nine first in both primary (42.6%) and network (48.1%) rankings.
Channel 7
Home & Away (467,000) led as Seven’s best, before the network programs away from the Origin with Dogs Behaving (Very) Badly (288,000) and Accused (146,000). The Front Bar (265,000) does good business in MEL (156,000) and nowhere else, before A repeat of Crime Investigation Australia: Most Infamous (63,000) runs out the late night.
Seven second in both primary (14.4%) and network (19.9%) rankings.
ABC
7:30 (445,000) and Utopia (474,000) led the ABC’s comedy night with a determined second place in primetime, followed by the fifteenth season premiere of Gruen (436,000) and the penultimate ep of In Limbo (151,000) doing their best in the following slot. New series Queen of Oz (143,000) ran into a repeat of Take 5 with Zan Rowe (59,000) and Ragdoll (DNR).
ABC third in both primary (9.8%) and network (13.9%) rankings.
Channel 10
The Project (174,000 6:30pm; 283,000 7pm) and MasterChef Australia (365,000) swing as hard as they can though ultimately come up in a distant third. A double ep of So Help Me Todd (110,000; 77,000) fills out the schedule for 10.
10 fourth in both primary (6.9%) and network (11.8%) rankings.
SBS
History of the Sitcom (76,000) delivers another great episode for SBS, followed by The Mayfair Hotel Megabuild (55,000) and Blue Lights (40,000).
SBS fifth in both primary (2.9%) and network (6.2%) rankings.
KEY DEMOS
16-39: State of Origin Game 2 (501,000) led State of Origin Game 2 Pre-Match/Post-Match, and Nine News 6:30pm/6pm.
18-49: State of Origin Game 2 (747,000) beat State of Origin Game 2 Pre-Match/Post-Match, and Nine News 6:30pm/6pm.
25-54: State of Origin Game 2 (818,000) lands a triple-demo win for Nine, followed by State of Origin Game 2 Pre-Match/Post-Match, and Nine News 6:30pm/6pm.
MULTI-CHANNELS
As The Ashes: First Test Day 5 S3 (164,000) came down to the wire for an Aussie win it delivered solid numbers in the early morning to 9Gem.
EVENING NEWS BATTLE
| Service | Time | O’nights (cume/avg) | Note |
| ABC News | 7pm-7:30pm | 587,000 | |
| SBS World News | 6:30pm-7:30pm | 154,000 | 172,000 6:30pm 136,000 7pm |
| Seven News | 6pm-7pm | 955,000 | 967,000 6pm 943,000 6:30pm |
| Nine News | 6pm-7pm | 823,000 | 825,000 6pm 820,000 6:30pm |
| 10 News First | 5pm-6:30pm | 225,000 5pm 152,000 6pm |
SBS World News averaged ((6:30pm+7pm)/2) to obtain total program figure.
Seven News/Nine News figures averaged ((6pm+6:30pm)/2) to obtain total program figure.
BREKKY BATTLE
Sunrise 215,000
The Today Show 210,000
ABC Breakfast 148,000 (98,000 ABC; 50,000 ABC News)
DAILY CONSOLIDATED 7 TOTAL TV
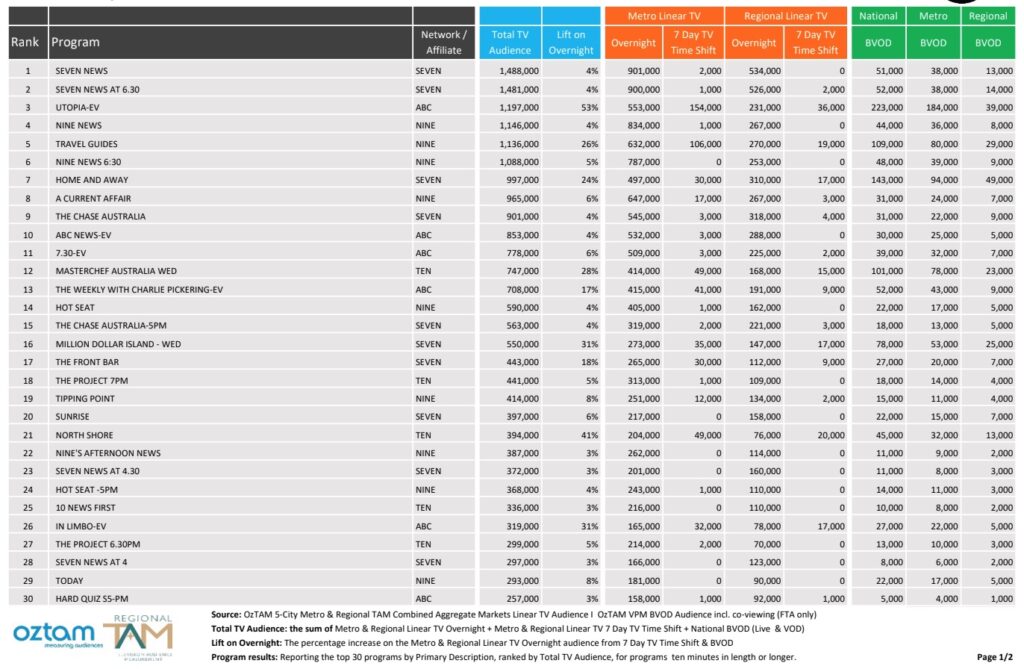
No changes to the previous week’s primetime line-up after the Total TV figures were added:
Travel Guides (Nine) lifted 26% to 1,136,000;
MasterChef Australia (10) lifted 28% to 747,000; and
Million Dollar Island Australia (Seven) lifted 31% to 550,000.
The BVOD best were Utopia (223,000), Home and Away (143,000), Travel Guides (109,000), and MasterChef Australia (101,000).
Here’s the five shows that lifted the most from their overnight figures:
| Program | Network | Total TV | % lift |
| Utopia | ABC | 1,197,000 | 53 |
| North Shore | 10 | 394,000 | 41 |
| Million Dollar Island Australia | Seven | 550,000 | 31 |
| In Limbo | ABC | 319,000 | 31 |
| MasterChef Australia | 10 | 747,000 | 28 |
Primary Channels, Multi-Channels, Shares, Subscription TV, Key Demos, Brekky Battle: All figures Total People, Five City Metro (5CM); overnights only.
Daily Consolidated 7 Total TV: All figures Total People, Consolidated 7 day Five City Metro (5CM) + Regional (Reg) + BVOD (Broadcast Video on Demand); % lift compared to overnight figures.
Top 20 Overnight Metro
Top 20 Multi-Channel Shows

Overnight Network Share
Top 20 Foxtel Shows

Daily Consolidated 7 Total TV Program Rankings
Data © OzTAM Pty Limited 2024. The data may not be reproduced, published or communicated (electronically or in hard copy) in whole or in part, without the prior written consent of OzTAM.
Note: Program performance and ranking information subject to change when not based on final program logs. Programs with the same name on one or more primary or multichannel, are aggregated into one network figure.