")
The best first game of the series for Nine since 2019 (the benefit of a game not in Sydney or Brisbane).
Channel 9
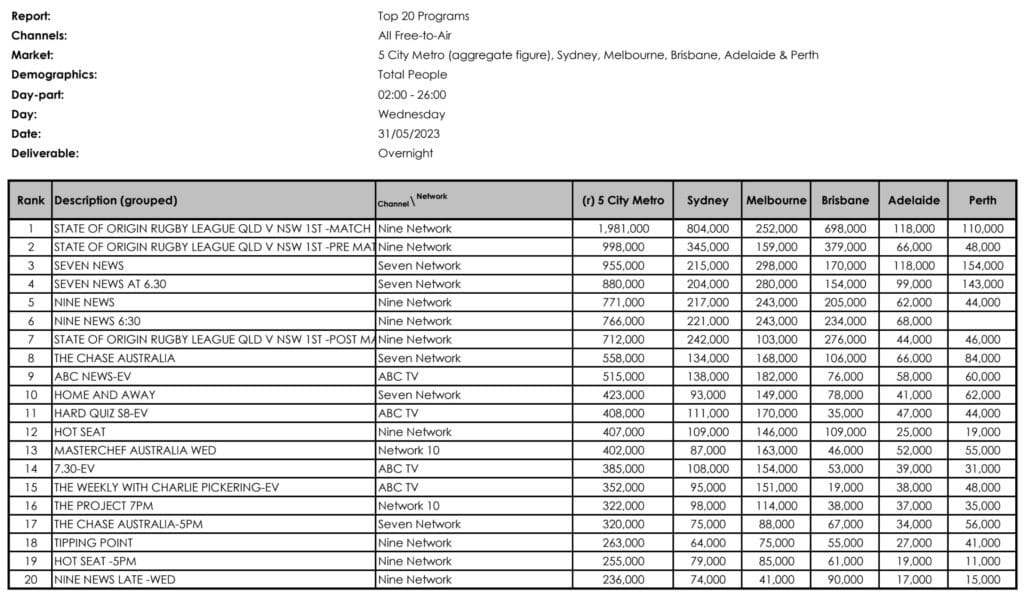
Nine’s first of three big Wednesdays for the year, starting with State of Origin Game 1 Pre-Match (998,000), then building into a strong State of Origin Game 1 (1,981,000), before the overnight BVOD numbers come in to lift this higher (536,000). State of Origin Game 1 Post-Game (712,000) carries the halo from the game, while New Amsterdam (101,000) airs in the late night.
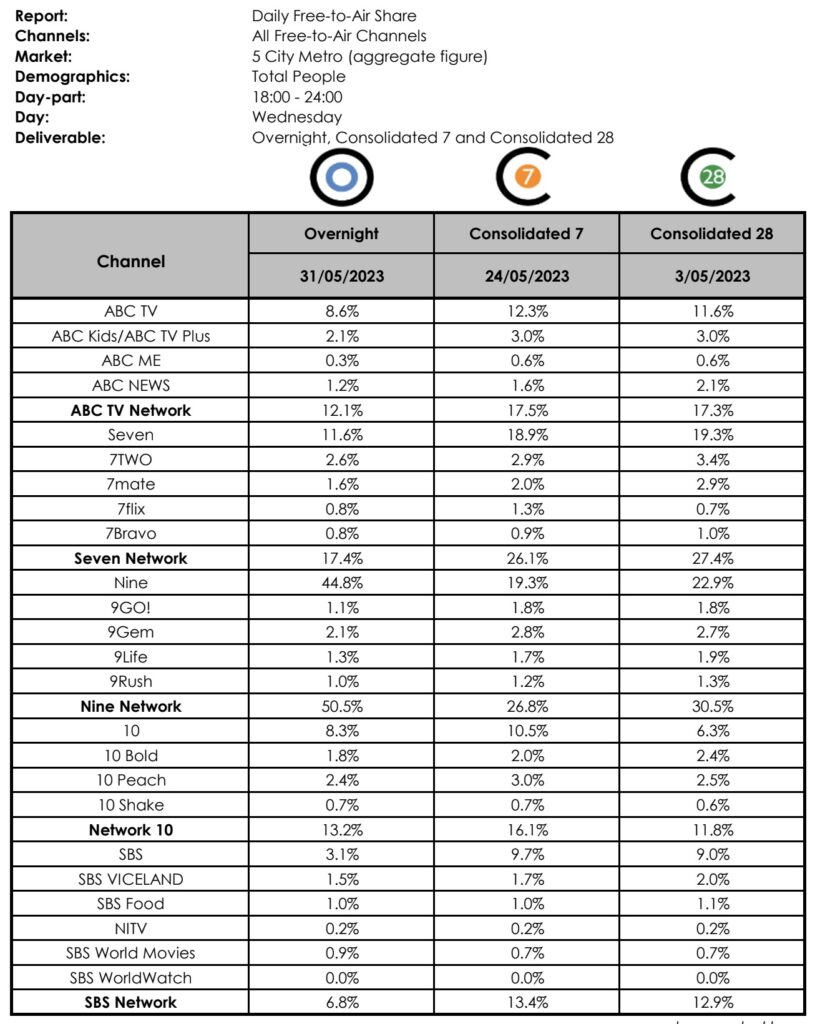
Nine first in both primary (44.8%) and network (50.5%) rankings.
Channel 7
Home & Away (423,000) starts as Seven’s best as they program away from the Origin, evidenced by Code 1: Minute by Minute (215,000). A double ep of Accused (124,000; 97,000) continues on with a diminishing audience, slipping into a repeat of Crime Investigation Australia: Most Infamous (47,000) at the end of the night.
Seven second in both primary (11.6%) and network (17.4%) rankings.
ABC
7:30 (385,000) and Hard Quiz (408,000) lead the ABC’s offering, sliding into The Weekly with Charlie Pickering (352,000) and In Limbo (172,000), with all shows down on Origin night. QI (148,000) is followed by repeats of Take 5 with Zan Rowe (75,000) and Ragdoll (DNR).
ABC third in primary (8.6%) and fourth in network (12.1%) rankings.
Channel 10
The Project (231,000 6:30pm; 322,000 7pm) continues to build into MasterChef Australia (402,000) which soldiers on given the competition. North Shore (183,000) continues to wane, with Law & Order: SVU (106,000), Fire Country (70,000), and repeat of Bull (46,000) filling out the schedule.
10 fourth in primary (8.3%) and third in network (13.2%) rankings.
SBS
History of the Sitcom (116,000 (double ep avg)) opens SBS’s night, followed by Blue Lights (53,000).
SBS fifth in both primary (3.1%) and network (6.8%) rankings.
KEY DEMOS
16-39: State Of Origin Game 1 (532,000) smashed State Of Origin Game 1 Pre-Match/Post-Match, Nine News 6:30pm, and Seven News 6pm.
18-49: State Of Origin Game 1 (797,000) beat out State Of Origin Game 1 Pre-Match/Post-Match, Nine News 6:30pm, and Seven News 6pm.
25-54: State Of Origin Game 1 (898,000) lands a triple-demo win for Nine, followed by State Of Origin Game 1 Pre-Match/Post-Match, and Seven News 6pm/6:30pm.
MULTI-CHANNELS
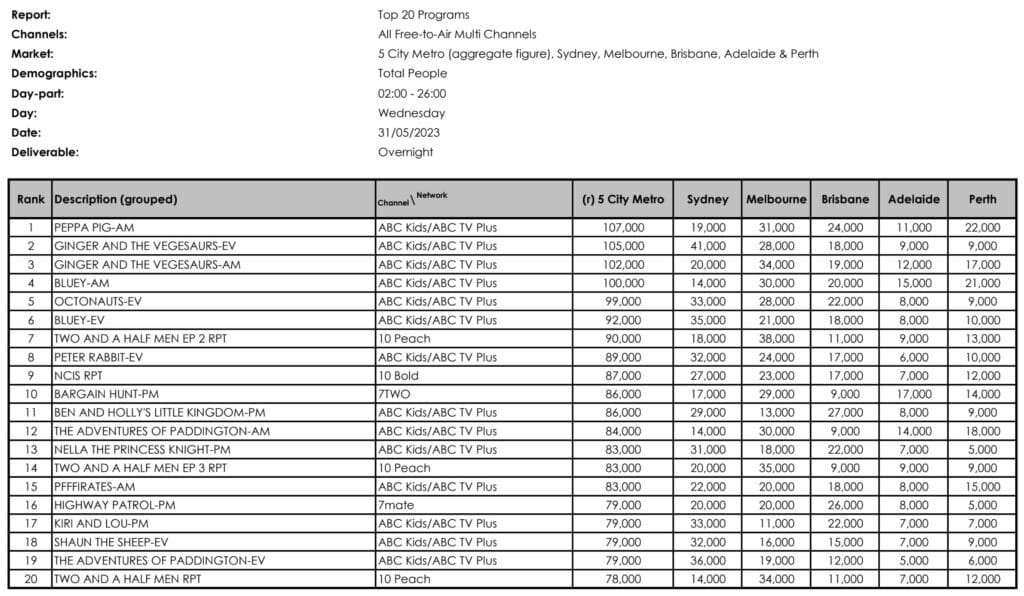
Peppa Pig – AM (107,000) delivers another multi-channel win for ABC Kids/TV Plus.
EVENING NEWS BATTLE
| Service | Time | O’nights (cume/avg) | Note |
| ABC News | 7pm-7:30pm | 515,000 | |
| SBS World News | 6:30pm-7:30pm | 132,000 | 145,000 6:30pm 119,000 7pm |
| Seven News | 6pm-7pm | 918,000 | 955,000 6pm 880,000 6:30pm |
| Nine News | 6pm-7pm | 769,000 | 771,000 6pm 766,000 6:30pm |
| 10 News First | 5pm-6:30pm | 236,000 5pm 190,000 6pm |
SBS World News averaged ((6:30pm+7pm)/2) to obtain total program figure.
Seven News/Nine News figures averaged ((6pm+6:30pm)/2) to obtain total program figure.
BREKKY BATTLE
Sunrise 227,000
The Today Show 202,000
ABC Breakfast 127,000 (81,000 ABC; 46,000 ABC News)
DAILY CONSOLIDATED 7 TOTAL TV
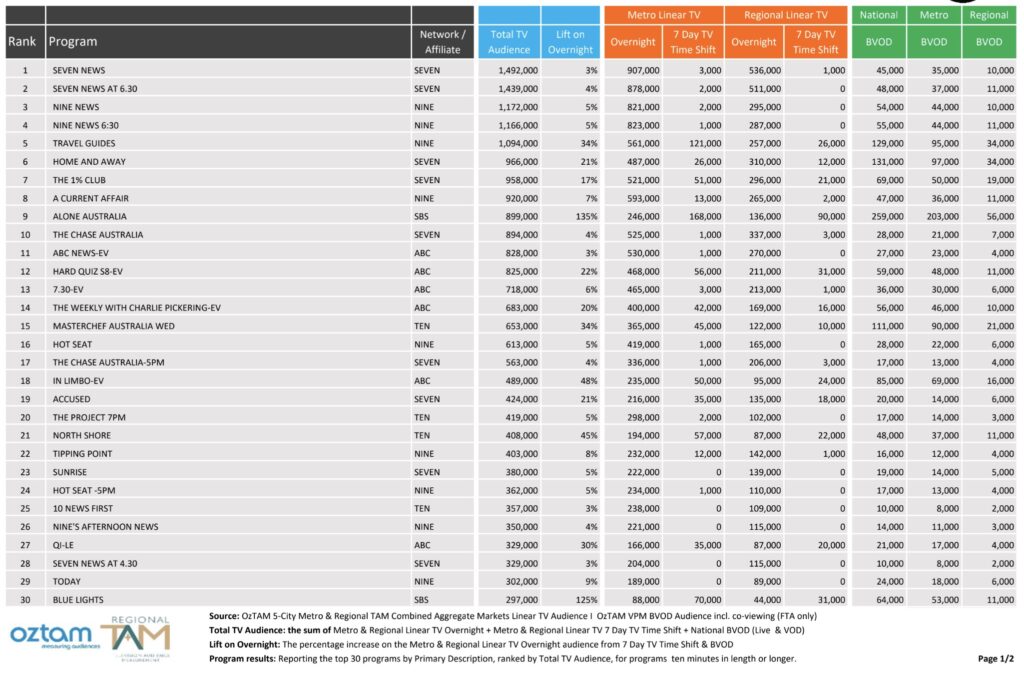
No changes to the previous week’s primetime line-up after the Total TV figures were added: Travel Guides (Nine) lifted 34% to 1,094,000; The 1% Club Australia (Seven) lifted 17% to 958,000; and MasterChef Australia (10) lifted 34% to 653,000.
The BVOD best were Alone Australia (259,000), Home and Away (131,000), Travel Guides (129,000), and MasterChef Australia (111,000).
Here’s the six shows that lifted the most from their overnight figures:
| Program | Network | Total TV | % lift |
| Alone Australia | SBS | 899,000 | 135 |
| Blue Lights | SBS | 297,000 | 125 |
| In Limbo | ABC | 489,000 | 48 |
| North Shore | 10 | 408,000 | 45 |
| Travel Guides | Nine | 1,094,000 | 34 |
| MasterChef Australia | 10 | 653,000 | 34 |
Primary Channels, Multi-Channels, Shares, Subscription TV, Key Demos, Brekky Battle: All figures Total People, Five City Metro (5CM); overnights only.
Daily Consolidated 7 Total TV: All figures Total People, Consolidated 7 day Five City Metro (5CM) + Regional (Reg) + BVOD (Broadcast Video on Demand); % lift compared to overnight figures.
Top 20 Overnight Metro
Top 20 Multi-Channel Shows
Overnight Network Share
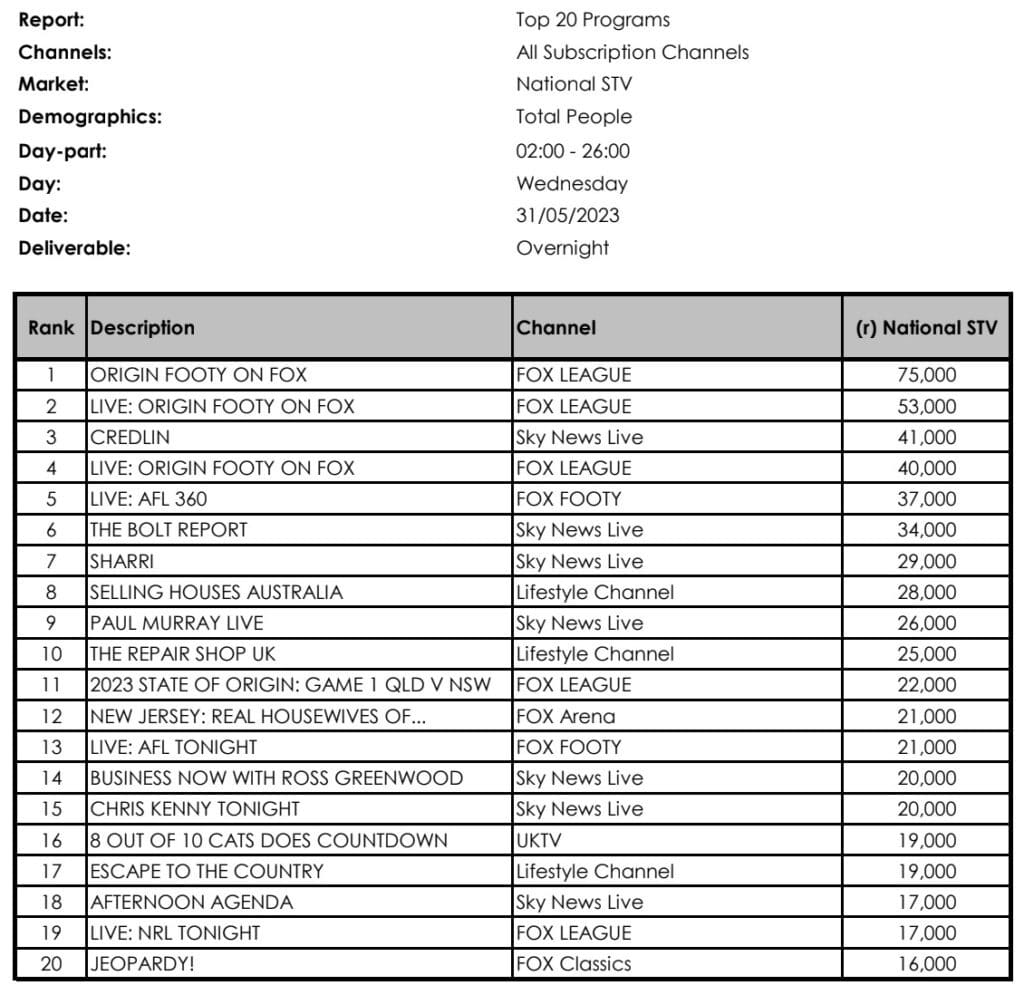
Top 20 Foxtel Shows
Daily Consolidated 7 Total TV Program Rankings
Data © OzTAM Pty Limited 2024. The data may not be reproduced, published or communicated (electronically or in hard copy) in whole or in part, without the prior written consent of OzTAM.
Note: Program performance and ranking information subject to change when not based on final program logs. Programs with the same name on one or more primary or multichannel, are aggregated into one network figure.